In Business Central it is standard to not show server specific information in telemetry. The reason for this is that many run the SaaS version which makes server information irrelevant since the end users don’t need to care about server information. However, some us still have customers that run OnPrem which this information can be quite useful. One of our customers has multiple servers with job queues activated on all of them. One way of troubleshooting job queues is to look at if a certain server is the source of problem and to do that we need server information in the telemetry.
In this blog entry I will explain how you can create your own telemetry message that send the job queue entry status and server information to application insights.
Telemetry Signals of Interest
The first step is to look where the standard Business Central sends it’s telemetry and then see if we can use an event nearby event to jack into and send our own telemetry. In order to do that we need to know the standard telemetry signals for job queue status.
This can be found in Telemetry Event IDs in Application Insights/Life Cycle Events. The events of interest are:
| Event ID | Area | Message |
| AL0000E26 | Job Queue Lifecycle | Job queue entry finished: {alJobQueueId} |
| AL0000HE7 | Job Queue Lifecycle | Job queue entry errored: {alJobQueueId} |
Find Telemetry Signals In Code
Now we need to find where these signals are sent in standard Business Central code. But before you start text searching for the event id:s it is important to know that the prefix AL of the event id is not defined in code. It is being added automatically when sent from BC. So instead of text searching for event AL0000E26, you should search for 0000E26.
This can be done in various ways.
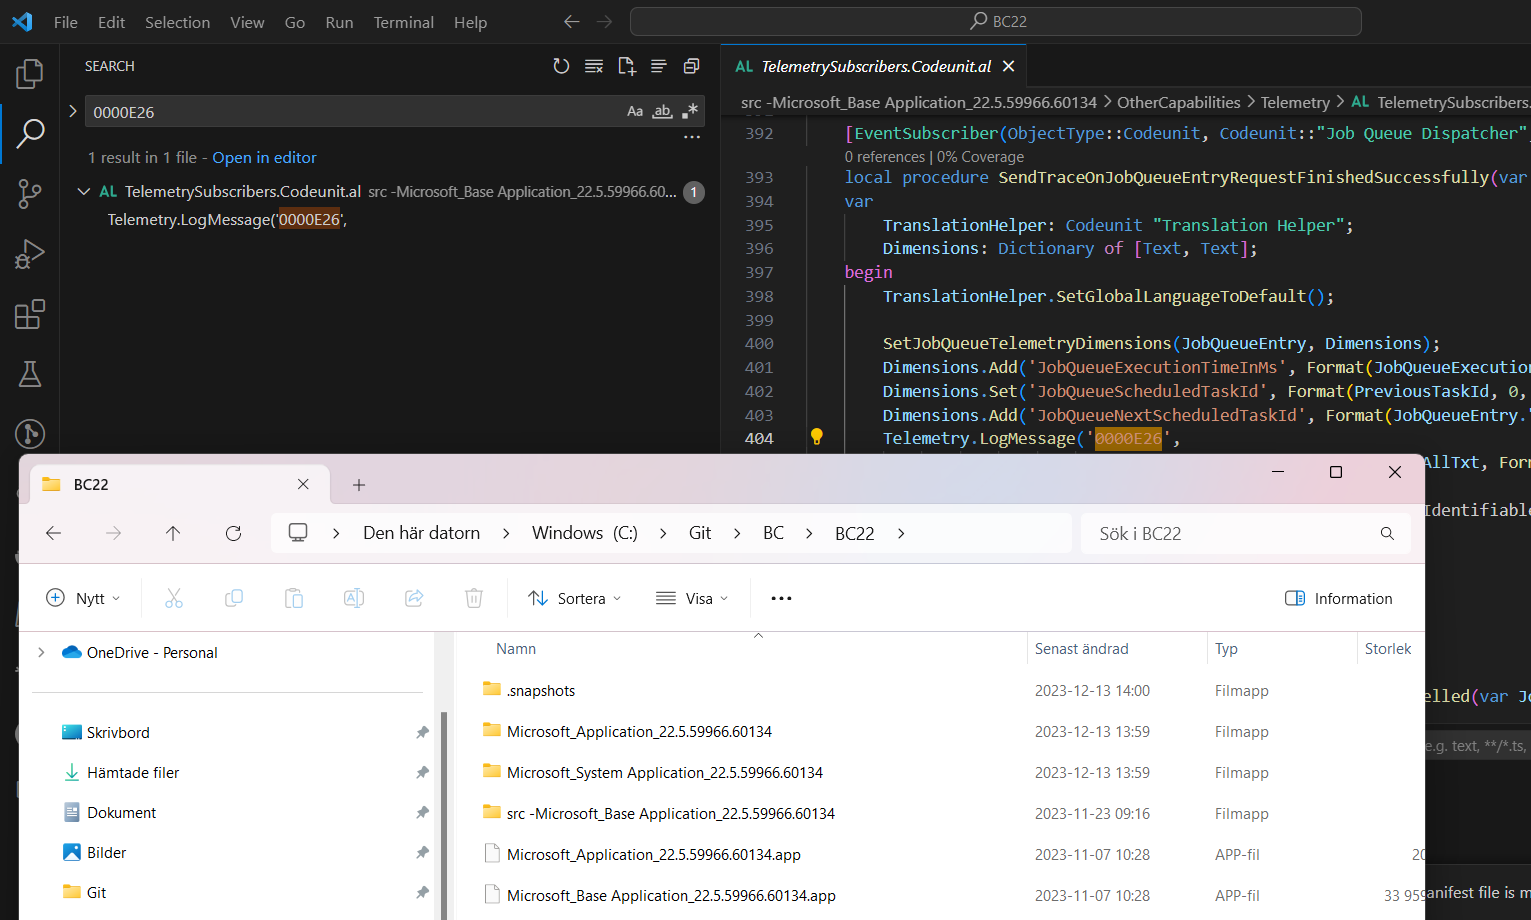
- Extract all the base app/system app symbols by using 7zip to a new working folder. Open the folder with VS Code, use the function CTRL+SHIFT+F that searches through all the files
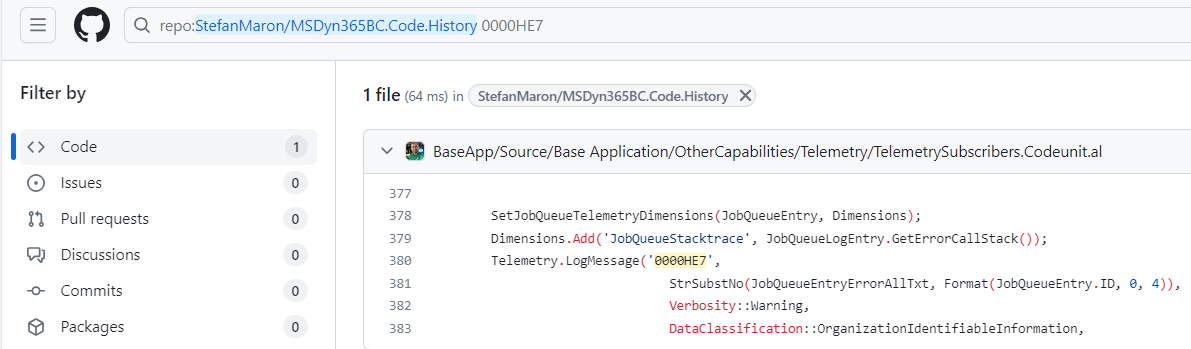
- Go to the MSDyn365BC.Code.History repository and search for it there or clone the repo and search for it in your own computer.
Example on how it can look like with MSDyn365BC.Code.History repository:
Another example when you have unpacked the system symbols and searched through it with VS Code:
Now we have found a function that sends one of the telemetry event and from that code we can draw the conclusion, the telemetry is sent from Codeunit Telemetry Subscribers and it is subscribing to an event which means that we can subscribe to the same event to send our own telemetry event.
    [EventSubscriber(ObjectType::Codeunit, Codeunit::"Job Queue Dispatcher", 'OnAfterSuccessHandleRequest', '', false, false)]
    local procedure SendTraceOnJobQueueEntryRequestFinishedSuccessfully(var JobQueueEntry: Record "Job Queue Entry"; JobQueueExecutionTime: Integer; PreviousTaskId: Guid)
    var
        TranslationHelper: Codeunit "Translation Helper";
        Dimensions: Dictionary of [Text, Text];
    begin
        TranslationHelper.SetGlobalLanguageToDefault();

        SetJobQueueTelemetryDimensions(JobQueueEntry, Dimensions);
        Dimensions.Add('JobQueueExecutionTimeInMs', Format(JobQueueExecutionTime));
        Dimensions.Set('JobQueueScheduledTaskId', Format(PreviousTaskId, 0, 4));
        Dimensions.Add('JobQueueNextScheduledTaskId', Format(JobQueueEntry."System Task ID", 0, 4));
        Telemetry.LogMessage('0000E26',
                                StrSubstNo(JobQueueEntryFinishedAllTxt, Format(JobQueueEntry.ID, 0, 4)),
                                Verbosity::Normal,
                                DataClassification::OrganizationIdentifiableInformation,
                                TelemetryScope::All,
                                Dimensions);

        TranslationHelper.RestoreGlobalLanguage();
    end;
If we search for the other telemetry event,AL0000HE7 but without the AL prefix we find following function:
[EventSubscriber(ObjectType::Codeunit, Codeunit::"Job Queue Error Handler", 'OnBeforeLogError', '', false, false)]
    local procedure SendTraceOnJobQueueEntryErrored(var JobQueueLogEntry: Record "Job Queue Log Entry"; var JobQueueEntry: Record "Job Queue Entry")
    var
        TranslationHelper: Codeunit "Translation Helper";
        Dimensions: Dictionary of [Text, Text];
    begin
        TranslationHelper.SetGlobalLanguageToDefault();

        SetJobQueueTelemetryDimensions(JobQueueEntry, Dimensions);
        Dimensions.Add('JobQueueStacktrace', JobQueueLogEntry.GetErrorCallStack());
        Telemetry.LogMessage('0000HE7',
                                StrSubstNo(JobQueueEntryErrorAllTxt, Format(JobQueueEntry.ID, 0, 4)),
                                Verbosity::Warning,
                                DataClassification::OrganizationIdentifiableInformation,
                                TelemetryScope::All,
                                Dimensions);

        TranslationHelper.RestoreGlobalLanguage();
    end;
It is also located in the object Codeunit Telemetry Subscribers and is also subscribing to an event which we can use.
Send Our Own Telemetry
Now we have two events we can subscribe to and from that send our own telemetry. What I did is that I copied the original code and tweaked it:
[EventSubscriber(ObjectType::Codeunit, Codeunit::"Job Queue Dispatcher", OnAfterSuccessHandleRequest, '', false, false)]
    local procedure SendTraceOnJobQueueEntryRequestFinishedSuccessfully(var JobQueueEntry: Record "Job Queue Entry"; JobQueueExecutionTime: Integer; PreviousTaskId: Guid)
    var
        Telemetry: Codeunit Telemetry;
        TranslationHelper: Codeunit "Translation Helper";
        Dimensions: Dictionary of [Text, Text];
        JobQueueEntryFinishedAllTxtTok: Label 'CompanyPrefix Job queue entry finished: %1', Comment = '%1 = Job queue id', Locked = true;
    begin
        TranslationHelper.SetGlobalLanguageToDefault();
        SetJobQueueTelemetryDimensions(JobQueueEntry, Dimensions);
        Session.LogMessage('CompanyPrefix0000E26', //# CompanyPrefix as prefix before original eventID, plus switched to session.LogMessage instead of Telemetry.LogMessage
                                StrSubstNo(JobQueueEntryFinishedAllTxtTok, Format(JobQueueEntry.ID, 0, 4)),
                                Verbosity::Normal,
                                DataClassification::SystemMetadata,
                                TelemetryScope::All,
                                Dimensions);
        TranslationHelper.RestoreGlobalLanguage();
    end;
As you can see I keep the original telemetry Id BUT I added the CompanyPrefix to it. Why? Because I like the idea that I can filter out all our custom telemetry with one filter.
Another thing is that I replaced Telemetry.LogMessage with Session.LogMessage. The reason for this is that Session.LogMessage is more straightforward were Telemetry.LogMessage can be used to log feature statistics and demands some supporting functions. Read more about feature telemetry here.
Now lets take a look at how I add the server specific data to the message:
// Copy from codeunit 1351 "Telemetry Subscribers"
    internal procedure SetJobQueueTelemetryDimensions(var JobQueueEntry: Record "Job Queue Entry"; var Dimensions: Dictionary of [Text, Text])
    begin
        JobQueueEntry.CalcFields("Object Caption to Run");
        Dimensions.Add('CompanyPrefixJobQueueId', Format(JobQueueEntry.ID, 0, 4));
        Dimensions.Add('CompanyPrefixJobQueueObjectName', Format(JobQueueEntry."Object Caption to Run"));
        Dimensions.Add('CompanyPrefixJobQueueObjectDescription', Format(JobQueueEntry.Description));
        Dimensions.Add('CompanyPrefixJobQueueObjectType', Format(JobQueueEntry."Object Type to Run"));
        Dimensions.Add('CompanyPrefixJobQueueObjectId', Format(JobQueueEntry."Object ID to Run"));
        Dimensions.Add('CompanyPrefixJobQueueStatus', Format(JobQueueEntry.Status));
        Dimensions.Add('CompanyPrefixJobQueueCompanyName', CompanyName);

        //Server specific telemety
        Dimensions.Add('CompanyPrefixServerInstanceId', format(Database.ServiceInstanceId()));
        Dimensions.Add('CompanyPrefixInstanceName', GetServerInstanceName());
        Dimensions.Add('CompanyPrefixServerName', GetServerName());
        Dimensions.add('CompanyPrefixPublicWebBaseUrl', GetUrl(ClientType::Web));
    end;
As you can see I still send some standard data that is sent via the original telemetry event just because I want a more complete message. I have also added the company prefix in front of it. The reason for it this time is to make it extra clear to the viewer it is custom made telemetry event.
The server specific data have I incapsulated into functions. More about that later.
In the the case of failing job queue entries it looks like this:
 [EventSubscriber(ObjectType::Codeunit, Codeunit::"Job Queue Error Handler", OnBeforeLogError, '', false, false)]
    local procedure SendTraceOnJobQueueEntryErrored(var JobQueueLogEntry: Record "Job Queue Log Entry"; var JobQueueEntry: Record "Job Queue Entry")
    var
        Telemetry: Codeunit Telemetry;
        TranslationHelper: Codeunit "Translation Helper";
        Dimensions: Dictionary of [Text, Text];
        JobQueueEntryErrorAllTxtTok: Label 'CompanyPrefix Job queue entry errored: %1', Comment = '%1 = Job queue id', Locked = true;
    begin
        TranslationHelper.SetGlobalLanguageToDefault();
        SetJobQueueTelemetryDimensions(JobQueueEntry, Dimensions);
        Dimensions.Add('JobQueueStacktrace', JobQueueLogEntry.GetErrorCallStack()); //# Stack Trace
        Dimensions.Add('CompanyPrefixErrorMessage', JobQueueEntry."Error Message"); //# Error Message
        Session.LogMessage('CompanyPrefix0000HE7', // CompanyPrefix as prefix before original eventID
                                StrSubstNo(JobQueueEntryErrorAllTxtTok, Format(JobQueueEntry.ID, 0, 4)),
                                Verbosity::Warning,
                                DataClassification::OrganizationIdentifiableInformation,
                                TelemetryScope::All,
                                Dimensions);

        TranslationHelper.RestoreGlobalLanguage();
    end;
Here I have added so it also sends the stack trace and the error message.
Before I show the server specific functions I need to explain something.
We are creating a function that will send telemetry data whenever a job queue finishes and fails. This means that it can send tons of data if job queue transactions are run every minut. With that in mind we need to think of the total size and the performance of sending this data.
In this scenario the extra data can be overlooked since we are not sending that much extra than standard. But from a performance perspective we don’t want do unnecessary operations that we don’t have to do.
That’s why I have declared this codeunit single instance. The reason for that is that the server specific information will be the same through the session. Hence why we can declare it single instance, get the information once, store it in global variables and then reuse it. On the other hand, someone might really know their job queues and say: “Don’t you know that it creates a new session for each job queue transaction which makes this single instance thingy irrelevant?”
My answer to that is: Yes! But it stills feel better to do it this way 😜
If you want to go nerd mode on job queue I recommend this.
codeunit 50290 "Add More Telemetry"
{
    SingleInstance = true;
    var
        Initilized: Boolean;
        ServerInstanceName: text;
        ServerName: text;

    local procedure Initlize()
    var
        ActiveSession: Record "Active Session";
    begin
        Initilized := true;
        ActiveSession.SetRange("Server Instance ID", Database.ServiceInstanceId());
        ActiveSession.setrange("Session ID", SessionId());
        if ActiveSession.FindFirst() then begin
            ServerName := ActiveSession."Server Computer Name";
            ServerInstanceName := ActiveSession."Server Instance Name";
        end;
    end;

    local procedure GetServerInstanceName(): text
    begin
        if not Initilized then
            initlize();
        exit(ServerInstanceName);
    end;

    local procedure GetServerName(): text
    begin
        if not Initilized then
            initlize();
        exit(ServerName);
    end;
....
}
Now we can install the app on an NST which is connected to an application instance and try it out.
Remember that it can take a couple of minutes before the telemetry arrives in application insights.
I have prepared this KQL query for you to find the new events:
// Is used when you are running job queues on multiple NST:s and you would like to know
// which server the job was running on.
// TODO: Replace all CompanyPrefix with your own prefix or blank
traces
| where timestamp > ago(1d)
//| where (timestamp >= datetime(2023-12-20 16:00)) and (timestamp < datetime(2023-12-20 23:59))
| where customDimensions.eventId startswith "ALCompanyPrefix"
| where (customDimensions.eventId == 'ALCompanyPrefix0000HE7') or (customDimensions.eventId == 'ALCompanyPrefix0000E26')
| project timestamp
, eventId = customDimensions.eventId
, message = message
, errorMessage = customDimensions.alCompanyPrefixErrorMessage
// jobQueueObject* dimensions contains the information about the object containing the code being run
, jobQueueObjectId = customDimensions.alCompanyPrefixJobQueueObjectId
, jobQueueObjectName = customDimensions.alCompanyPrefixJobQueueObjectName // added in 22.0
, serverName = customDimensions.alCompanyPrefixServerName
, instanceId = customDimensions.alCompanyPrefixServerInstanceId
, publicWebBaseUrl = customDimensions.alCompanyPrefixPublicWebBaseUrl
, companyName = customDimensions.alCompanyPrefixCompanyName
, customDimensions
The result looks like this:
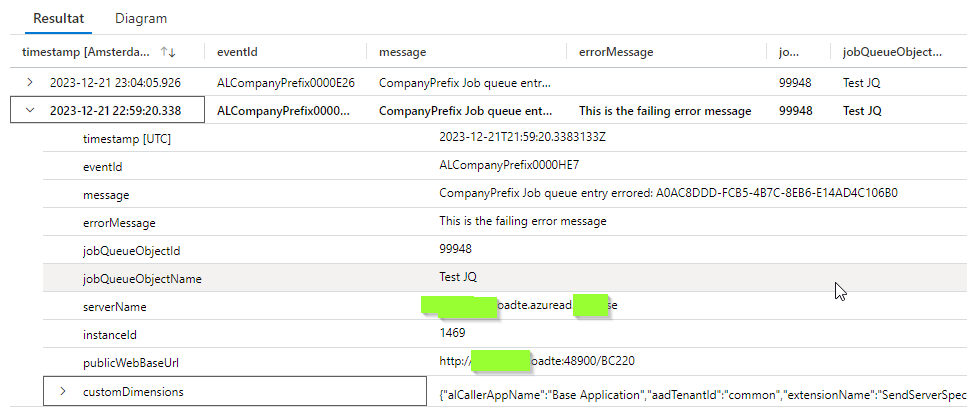
In this example I’m running this on only one server but I have run it on a system where it does.
Some comments:
- publicWebBaseURL will only look good if you have configured the setting on the NST
- If you use scale sets, the server name could be the image name of the scale set which makes the server name same for all in the scale set. But in theory they should all work the same way.
Summary
It is possible to send telemetry from Business Central that shows which server the operation has been executed on. In this blog we did this by creating our own telemetry event for finished/failed job queue entries. To be able to do that we had to find out where the original telemetry is sent from and then subscribe to the same event but send our own data.
